Responses Table Redesign
Responses
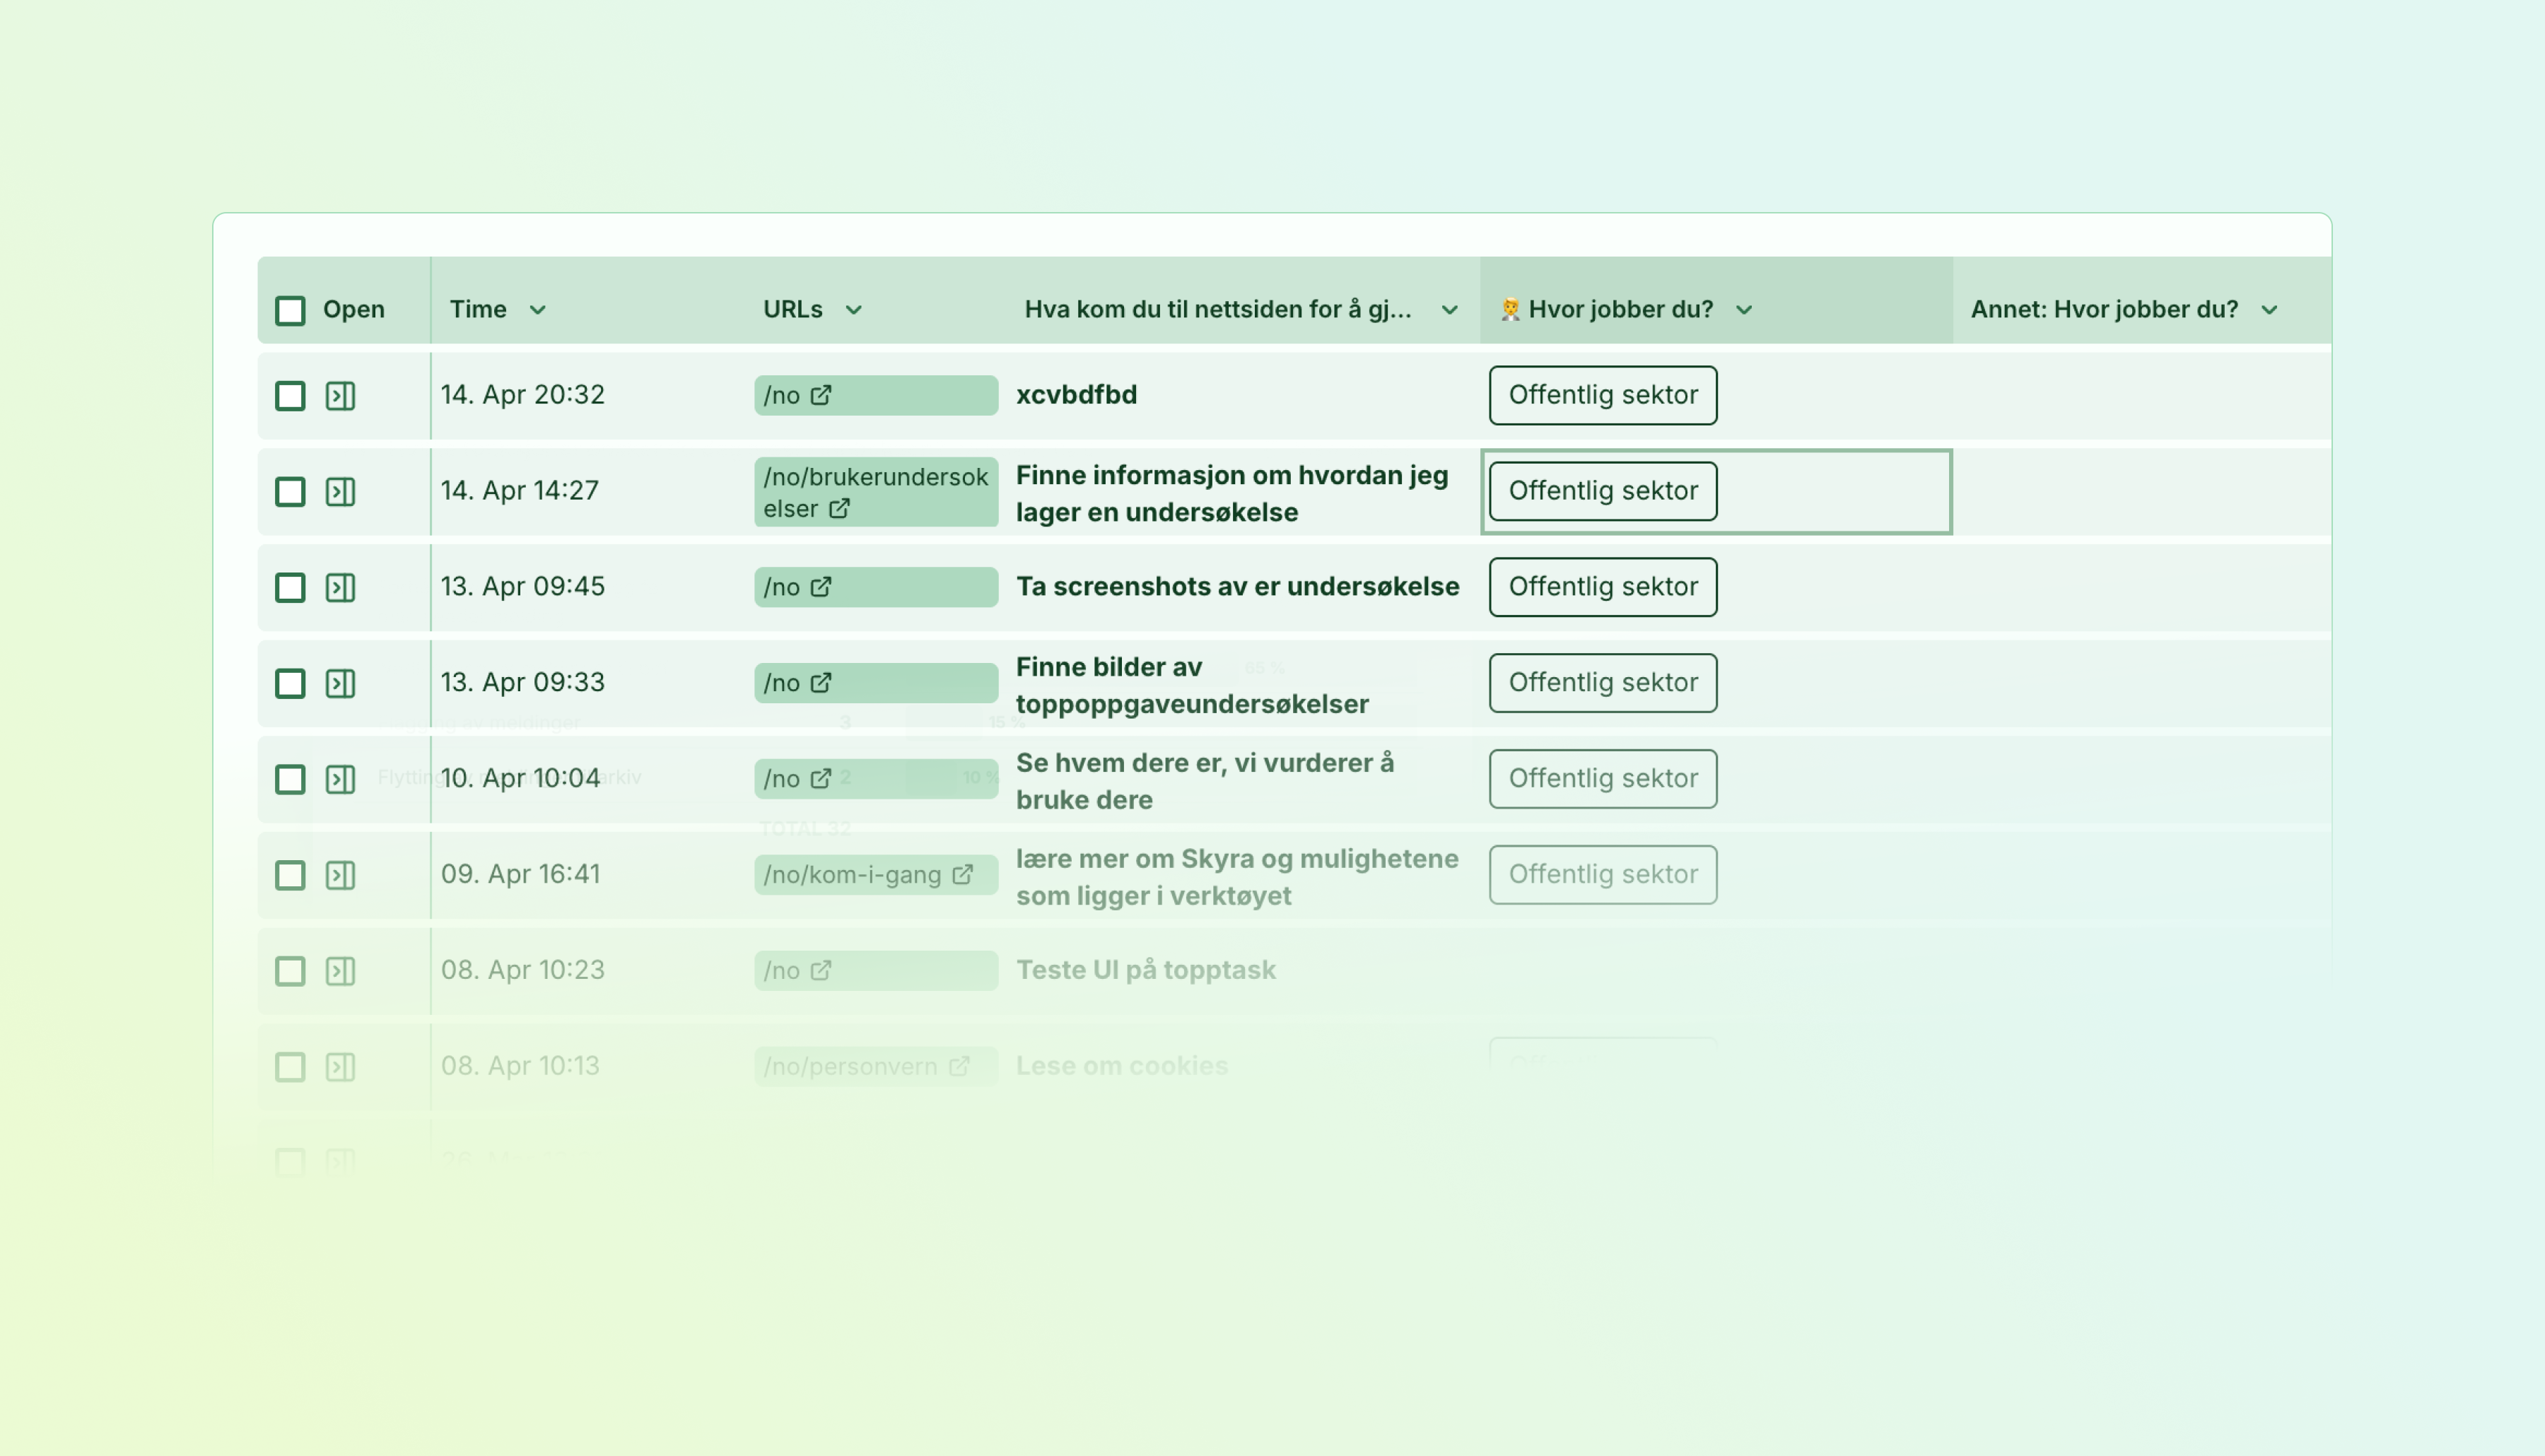
The responses table has been rebuilt from the ground up for speed and keyboard-driven workflows. Navigate thousands of responses without touching your mouse.
- Spreadsheet-style navigation — Arrow keys move between cells, Enter expands content, and vim-style hjkl works too.
- Find in table (Ctrl/Cmd+F) — Search across all visible data with instant highlighting. Jump between matches with Enter or F3.
- Jump navigation (Ctrl/Cmd+Arrow) — Leap across empty cells to data regions, just like Excel or Google Sheets.
- Zen mode (z) — Fullscreen view for distraction-free analysis.
- Quick actions from keyboard — Select rows, assign tasks, add labels, explore card data — all without leaving the keyboard.
- Label distribution in headers — Click any Label column header to see counts and filter by label.
- Time & Completion explorers — Dive into response timing patterns and completion rates with interactive heatmaps and trend charts.
Press . to see all available shortcuts, organized by category with the correct modifier keys for your platform.
Built for Large Datasets
The table uses column virtualization — only visible columns render to the DOM, so surveys with dozens of questions stay fast. Horizontal scrolling is smooth regardless of column count.
The viewport-constrained layout means the table fills your screen height and scrolls internally. Headers and pagination stay fixed, so you never lose your place.
Find in Table
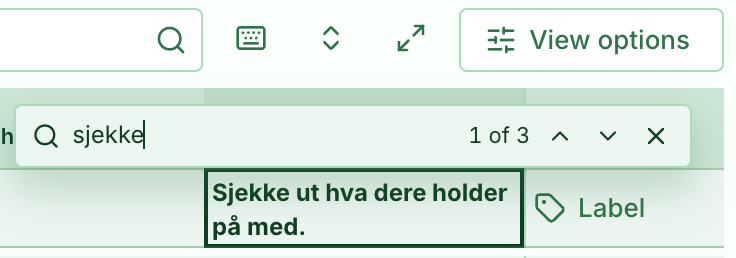
Press Ctrl+F (or Cmd+F on Mac) to open the search overlay. Matches highlight instantly in yellow, with the current match emphasized. Press Enter or F3 to jump between matches, Escape to close.
The search sets your active cell to each match, so you can immediately press o to open the sidebar, c to copy, or any other action shortcut.
Zen Mode
Press z to enter zen mode — a fullscreen view that removes distractions while keeping filters and pagination accessible. Press z again or Escape to exit.
Label Distribution
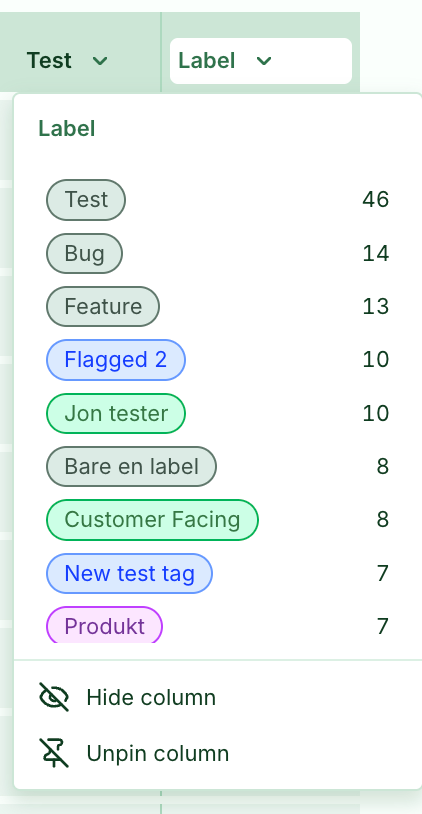
Click any Label column header to see the distribution across your current filtered view. Colored pills show counts for each label — click one to instantly filter to those responses.
Time & Completion Explorers
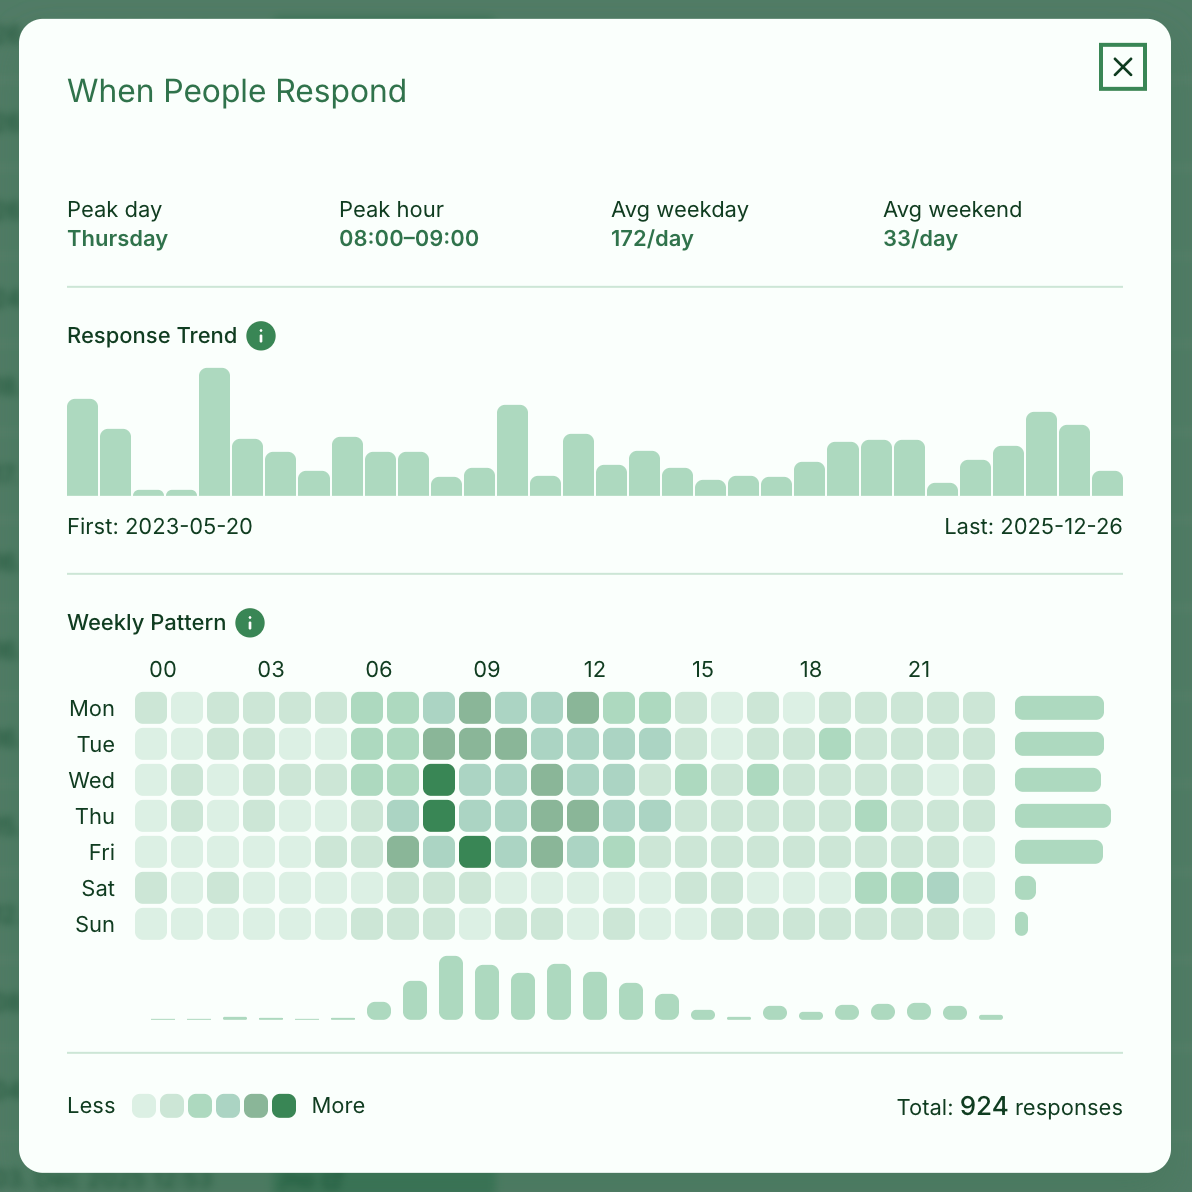
Click "Explore" on the Time column header to see when your responses arrive. The explorer shows a response trend sparkline, a weekly pattern heatmap, and summary stats like peak day and hour.
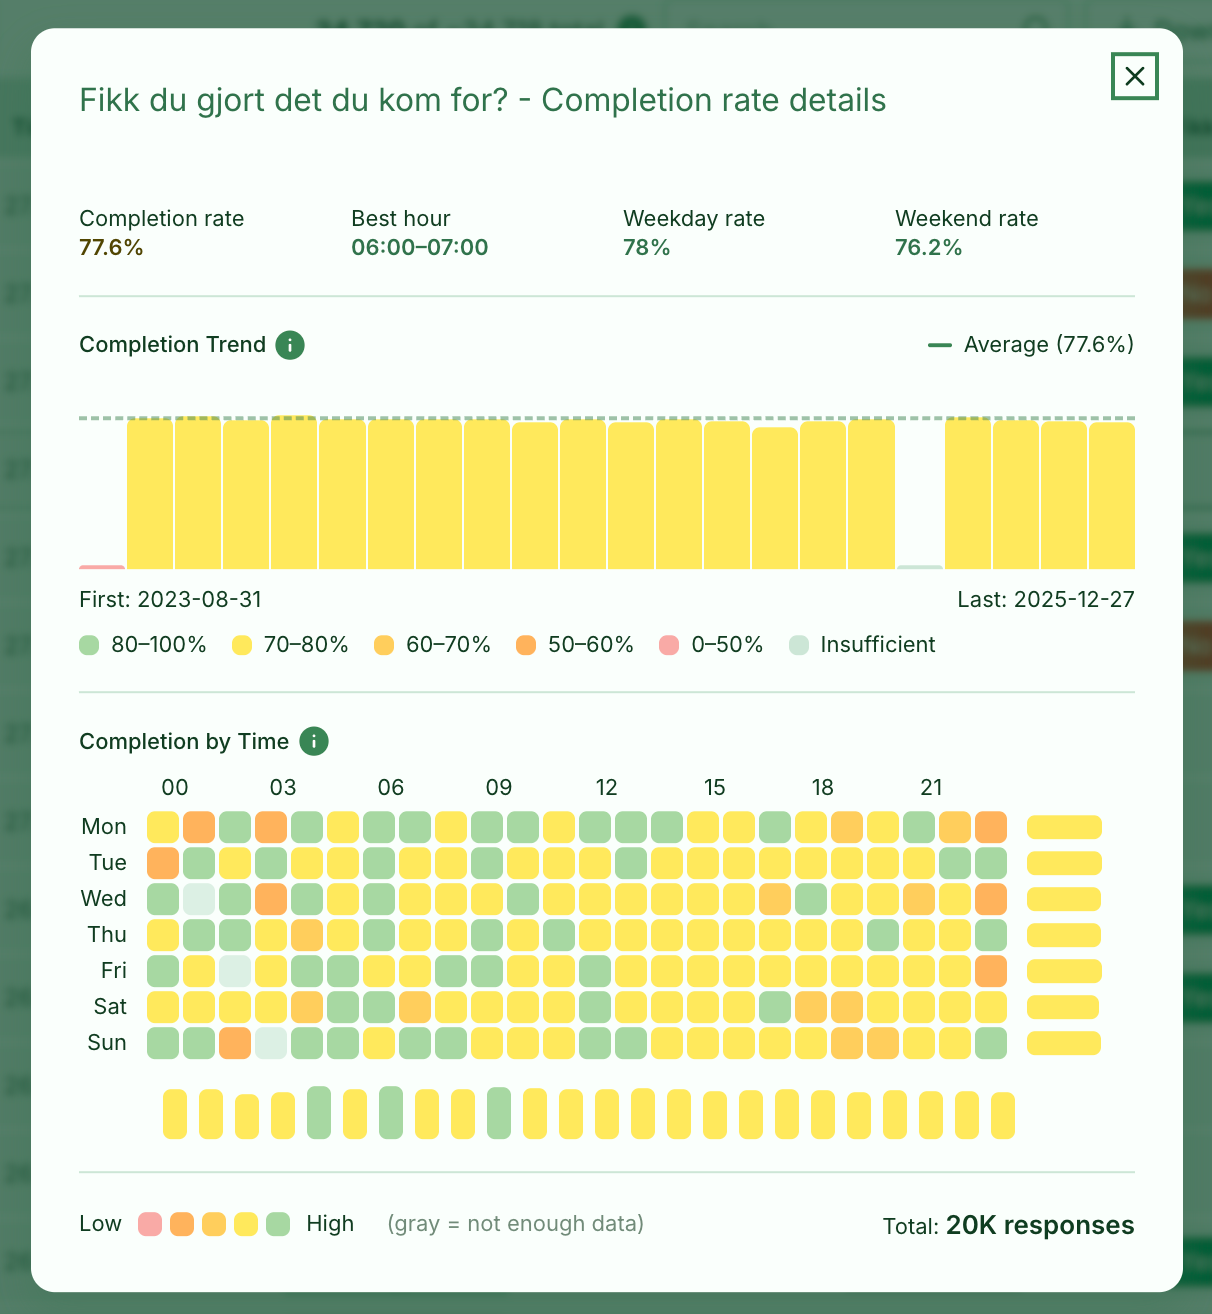
For Completion columns in Top Task surveys, the explorer reveals how completion rates vary by time of day and day of week. Bar colors use traffic light thresholds so you can spot problem times at a glance. The dashed reference line shows your overall average.
You can also open the Completion Explorer from the "Explore" button in any Completion card report.
Keyboard Reference
Navigation:
| Key | Action |
|---|---|
| Arrow keys | Move between cells |
| h, j, k, l | Vim-style navigation |
| Ctrl/Cmd+Arrow | Jump to next data region |
| Ctrl/Cmd+Home | Jump to first cell |
| Ctrl/Cmd+End | Jump to last cell |
| Enter / Space | Expand cell content |
| Ctrl/Cmd+F | Find in table |
| F3 / Shift+F3 | Next/previous match |
| n / p | Next/previous page |
Actions:
| Key | Action |
|---|---|
| o | Open response sidebar |
| c | Copy cell value |
| Shift+C | Copy entire row as CSV |
| x | Toggle row selection |
| r | Assign task to response |
| t | Add label to response |
| e | Explore card data |
| z | Toggle zen mode |
| a | Expand/collapse all rows |
| . | Show keyboard shortcuts |
Available on Essentials and above.
Top Task-specific reporting requires access to the Top Tasks module.